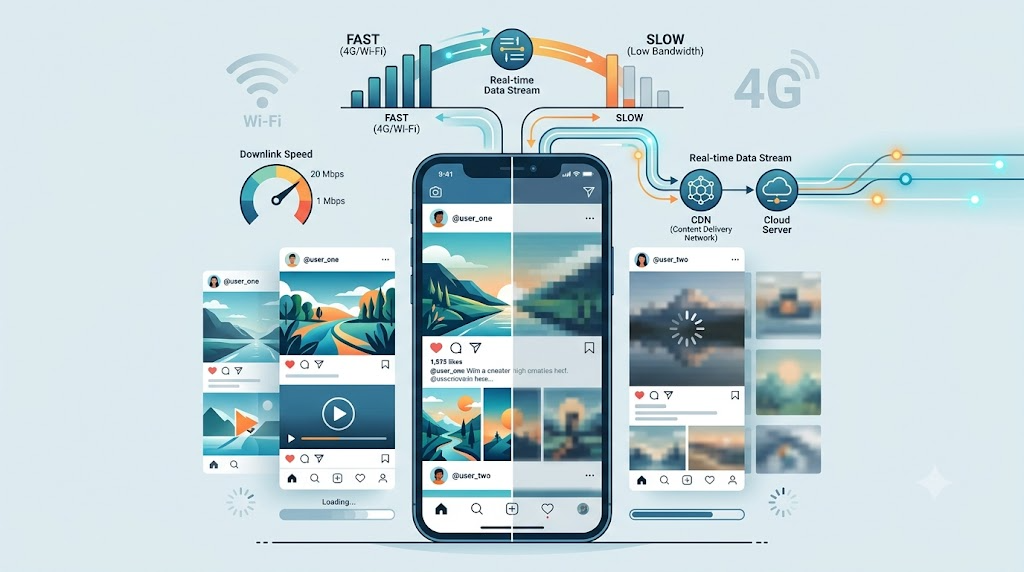
For feed-style products like Weibo, image lists are everywhere. On mobile, those images are often served as 2x or even 3x assets to preserve visual quality on high-density screens.
That looks better, but it also costs more bandwidth. When the user’s network is poor, large images may load slowly, fail halfway, or block the content experience entirely.
A common historical strategy was simple:
If the user is on Wi-Fi, load high-DPI images. If the user is on 3G or 4G, load 1x images.
That strategy made sense when mobile data was expensive. But as an experience strategy, it is not accurate enough.
Wi-Fi can be slow. 4G can be fast. A user on Wi-Fi with a weak signal may need smaller images, while a user on fast mobile data may prefer full-quality media.
The better question is not:
Is the user on Wi-Fi?
It is:
How good is the user’s actual network experience right now?
Why Front-End Network Awareness Matters
There are many cases where knowing the user’s network condition can improve the product experience.
For example, ffmpeg.wasm can load a large core JavaScript file, often over 20 MB. If that file is loaded inside business code without exposing accurate progress, the interface has no reliable way to show a meaningful loading state.
Another example: a homepage may include a nice but non-essential 3D animation. If the user’s network is poor, skipping that animation is better than delaying the core page.
Uploads are another common case. If the user is uploading a large file on a slow connection, the product can show a message like:
Your current network is not very good. This may take a while.
These small decisions make the experience feel more considerate.
So, how do we detect network quality in the browser?
Enter navigator.connection.downlink
Chrome and some Chromium-based browsers expose the Network Information API through navigator.connection.
The downlink property gives an estimated effective bandwidth value in Mbps. At first glance, this sounds perfect.
In practice, it is only a rough signal.
A high downlink value does not guarantee that a resource will load quickly. The user may have other downloads running. The server may be slow. The CDN may be congested. The user may be far from the origin. Packet loss may happen.
So navigator.connection.downlink is useful as a hint, but not reliable enough to be the only decision-maker.
Here is a practical way to read the available network information with feature detection:
function readNetworkInformation() {
  const connection =
    navigator.connection ||
    navigator.mozConnection ||
    navigator.webkitConnection;

  if (!connection) {
    return {
      supported: false,
      message: "Network Information API is not supported in this browser."
    };
  }

  return {
    supported: true,
    downlink: connection.downlink ?? "unknown",
    downlinkMax: connection.downlinkMax ?? "unknown",
    effectiveType: connection.effectiveType ?? "unknown",
    rtt: connection.rtt ?? "unknown",
    saveData: connection.saveData ?? false,
    type: connection.type ?? "unknown"
  };
}
This code avoids assuming browser support. If the API is missing, the application can fall back to a manual strategy.
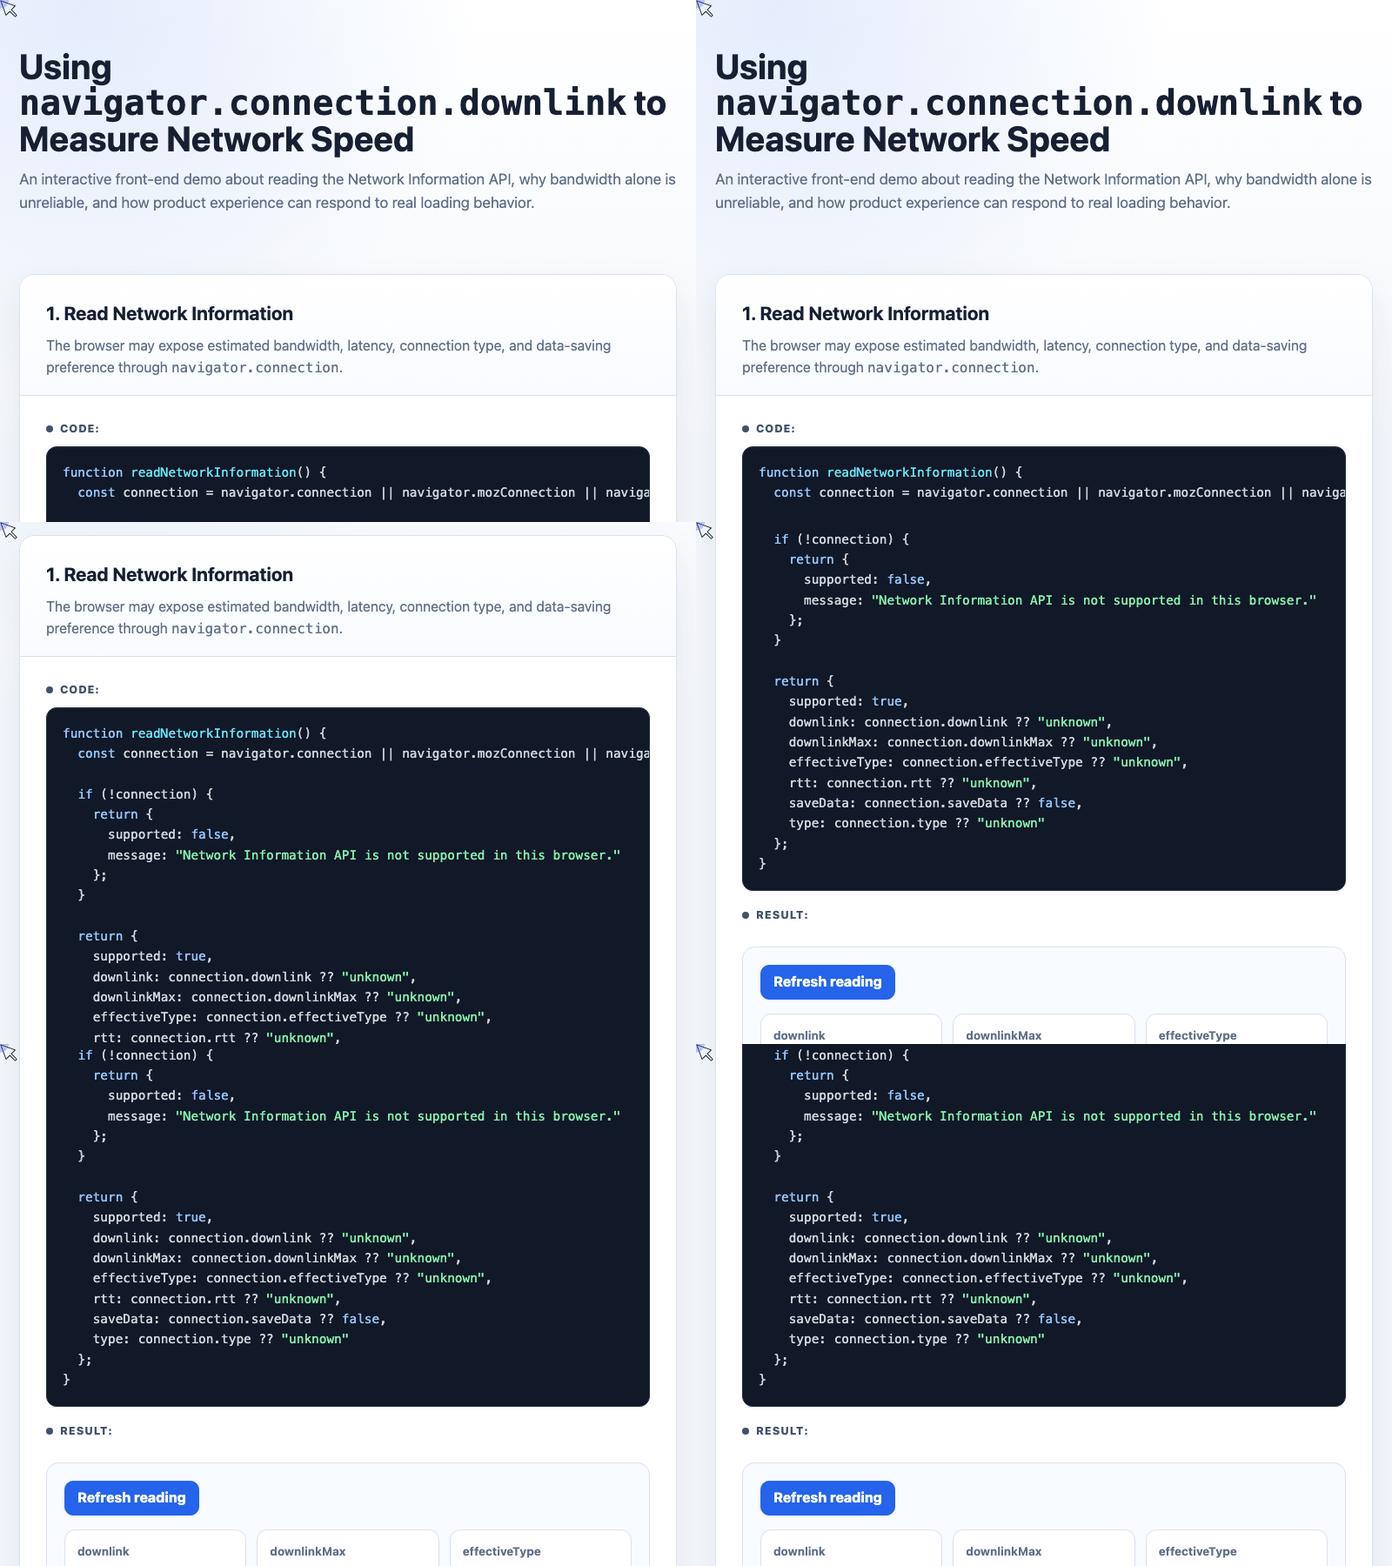
🎮 Try it live: Open the interactive demo to experience this yourself.
What the Network Information Object Can Tell You
A typical navigator.connection object may include fields like:
{
  downlink: 10,
  downlinkMax: Infinity,
  effectiveType: "4g",
  rtt: 100,
  saveData: false,
  type: "ethernet"
}
Some fields are more useful than others.
downlink estimates bandwidth. effectiveType gives a simplified category such as 4g. rtt estimates round-trip latency. saveData tells you whether the user has enabled a data-saving preference.
downlinkMax, however, may return values like Infinity, which is not very useful for real product decisions.
The important lesson is this: the API can help, but it cannot replace actual measurement.
Use Bandwidth as a Hint, Not the Truth
A simple strategy might use downlink and saveData to decide whether to load high- or low-resolution images.
function chooseImageQuality(downlink, saveData) {
  if (saveData) {
    return "low";
  }

  if (downlink >= 5) {
    return "high";
  }

  return "low";
}
This is easy to understand and cheap to implement.
If the user has data saver enabled, load smaller images. If the estimated bandwidth is high enough, load higher-quality images. Otherwise, prioritize fast readable content.
But this should not be treated as a final truth. It is only an initial guess.
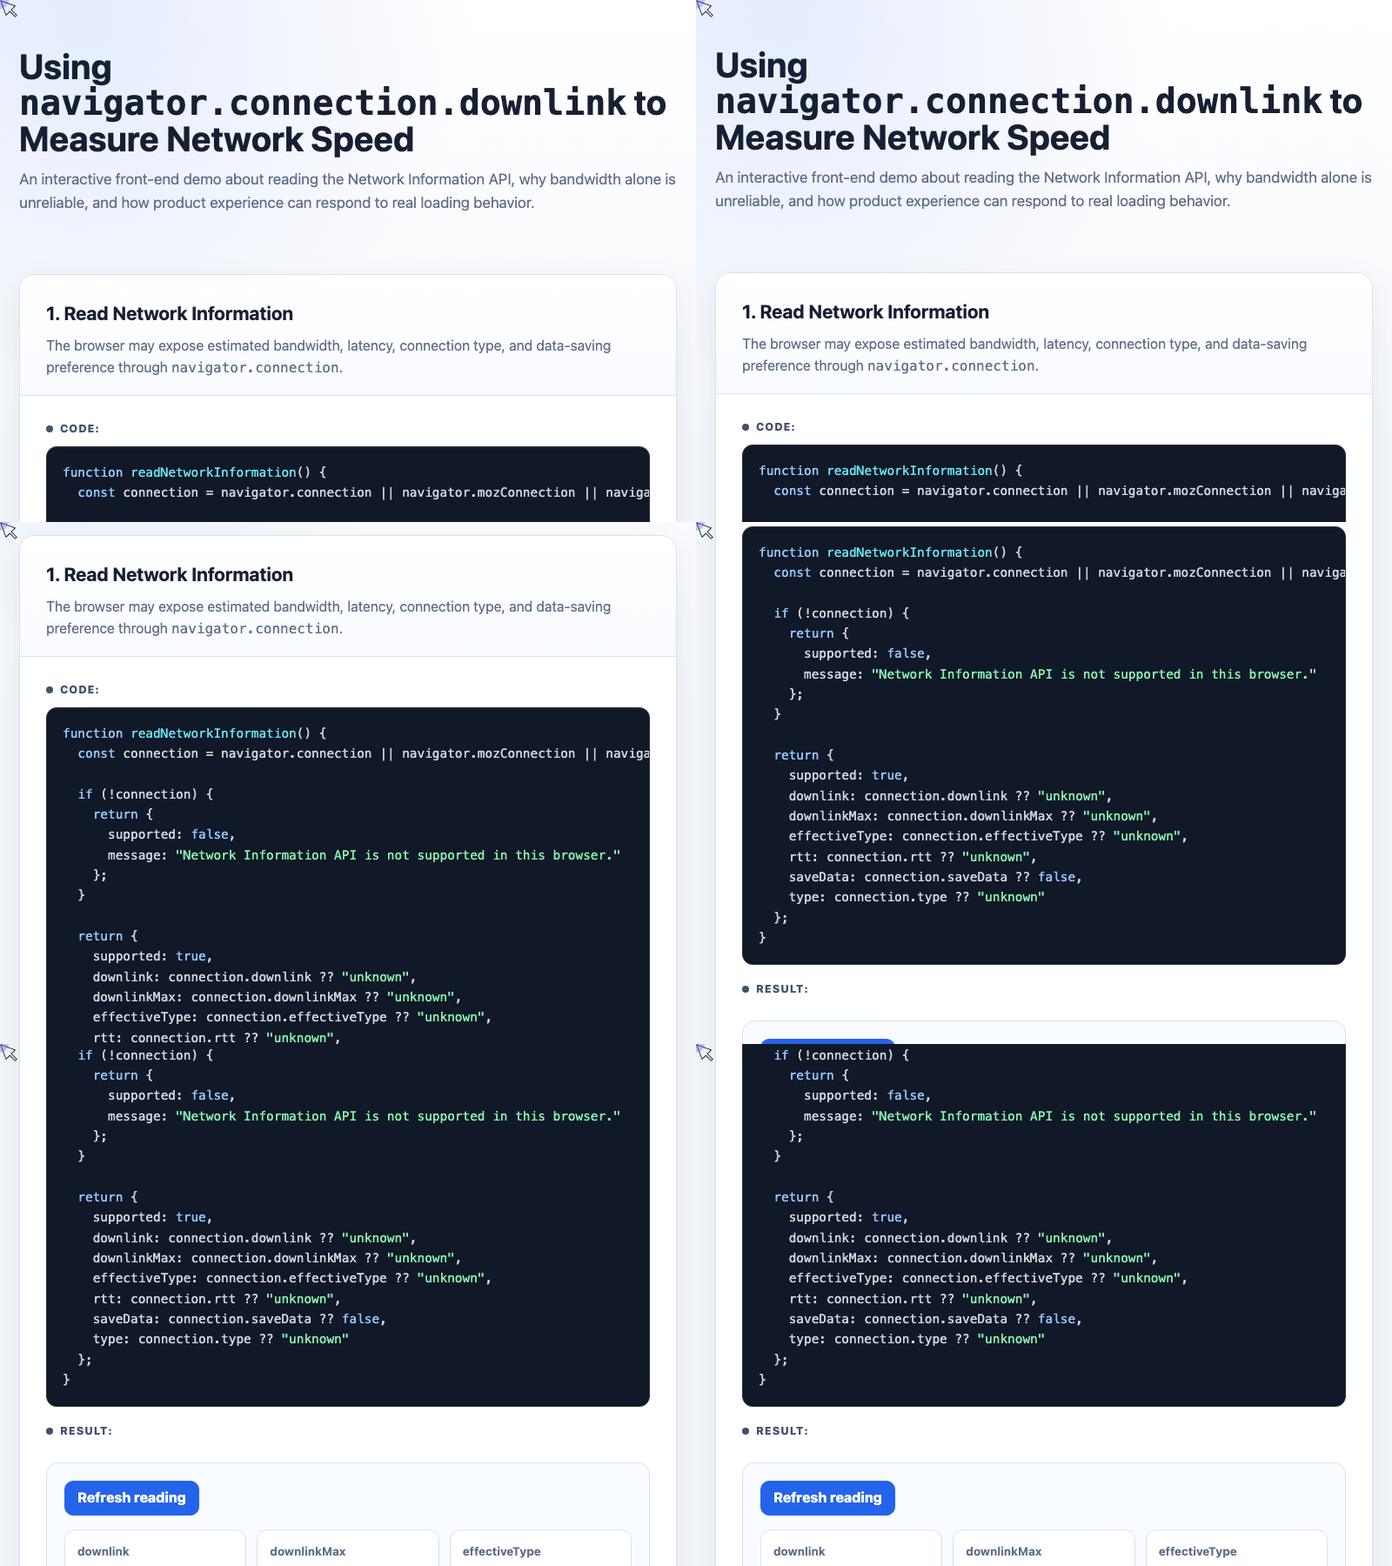
🎮 Try it live: Open the interactive demo to experience this yourself.
Reacting to Network Changes
The Network Information API may also emit a change event when connection information changes.
That means the front end can update behavior after the user moves from one network condition to another.
function watchConnectionChanges(onChange) {
  const connection =
    navigator.connection ||
    navigator.mozConnection ||
    navigator.webkitConnection;

  if (!connection) {
    onChange("Connection change events are not supported here.");
    return;
  }

  connection.addEventListener("change", () => {
    onChange(
      "Network changed: " +
      connection.effectiveType +
      ", " +
      connection.downlink +
      " Mbps"
    );
  });
}
This can be useful for adaptive behavior, such as switching feed images to smaller previews, skipping optional animations, or showing upload warnings.
Still, support and behavior vary between browsers, so this should remain progressive enhancement.
Measure Real Resource Loading
For image-heavy feeds, a better strategy is to measure how actual resources load.
Images already need lazy loading in many products. If you request images through XMLHttpRequest or another controlled loading mechanism, you can observe progress and timing.
The demo simulates that idea with a measurable resource load:
function measureResourceLoad(sizeKb, speedKbps, onProgress, onComplete) {
  const totalBytes = sizeKb * 1024;
  let loadedBytes = 0;
  const bytesPerTick = speedKbps * 1024 / 10;
  const startedAt = performance.now();

  const timer = setInterval(() => {
    loadedBytes = Math.min(totalBytes, loadedBytes + bytesPerTick);

    onProgress({
      loaded: loadedBytes,
      total: totalBytes,
      percent: Math.round((loadedBytes / totalBytes) * 100)
    });

    if (loadedBytes === totalBytes) {
      clearInterval(timer);
      onComplete(Math.round(performance.now() - startedAt));
    }
  }, 100);
}
The key idea is not the simulation itself. The key idea is measuring real completion time and progress.
In production, avoid judging the network from a single request. One image may be slow because of random packet loss or a temporary server delay. A better approach is to combine several samples.
If many resources fail, timeout, or load too slowly, the product can treat the network as poor and switch strategies.
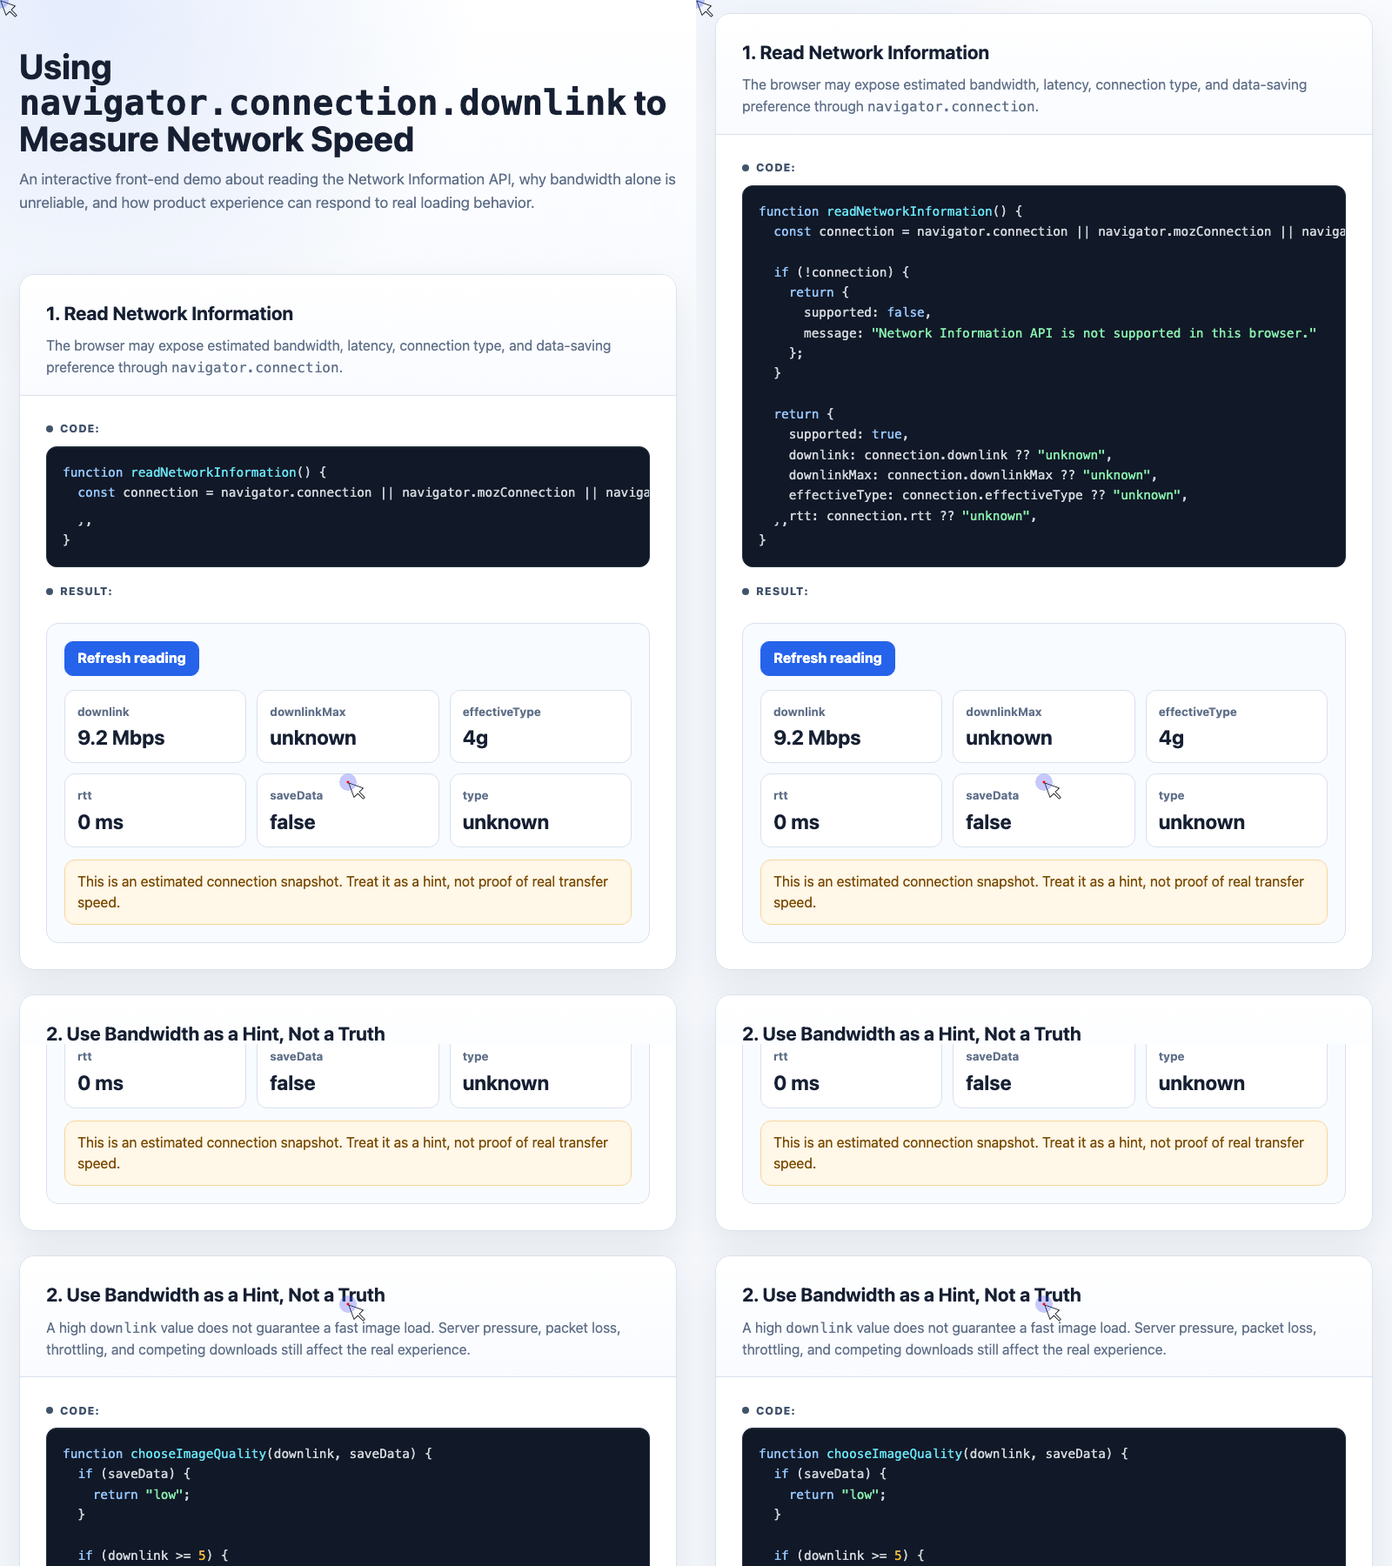
🎮 Try it live: Open the interactive demo to experience this yourself.
Give the User a Choice
Sometimes the best strategy is not to decide everything automatically.
WeChat provides a familiar example. Images are compressed by default so users can see content quickly. If they want the full-quality version, they can tap “View Original.”
That is a good product decision. It prioritizes readability first, then gives control back to the user.
The same idea applies to video resolution. Almost every video platform lets users switch between different resolutions. If playback is not smooth, users can choose a lower-quality stream.
Here is a small version of that idea:
function applyUserQualityChoice(choice) {
  return {
    quality: choice,
    label:
      choice === "original"
        ? "Original image requested"
        : "Compressed image shown first",
    estimatedSize: choice === "original" ? "3.6 MB" : "420 KB"
  };
}
The product does not need to be perfect at predicting the network. It only needs to make the default reasonable and give users a clear path to override it.
Uploads Need the Same Treatment
Uploads can also adapt to poor network conditions.
If the upload speed is slow, the product can extend timeout thresholds, avoid premature failure, and show a realistic duration message.
function estimateUpload(fileMb, uploadMbps) {
  const seconds = Math.ceil((fileMb * 8) / uploadMbps);
  const slow = seconds > 20;

  return {
    seconds,
    timeoutSeconds: slow ? seconds + 30 : seconds + 10,
    message: slow
      ? "Your current network is not very good. This may take a while."
      : "Upload should finish soon."
  };
}
This kind of feedback reduces user anxiety. It also prevents the interface from looking frozen when the real problem is simply a slow connection.
Good Experience Costs More
A good user experience often means more code, more branches, and more special-case handling.
That is uncomfortable for many developers. Clean abstractions, reuse, and automation are easier to maintain. But user experience often lives in the exceptions.
Network-aware image loading, upload estimation, resource skipping, and user-controlled quality settings all add complexity. They may not look elegant in code. But they can make the product feel significantly better.
The key is to be pragmatic:
Use navigator.connection.downlink as a hint.
Use saveData as a strong user preference.
Measure real resource loading when accuracy matters.
Give users control when automatic decisions are uncertain.
Prioritize readable content before visual perfection.
navigator.connection.downlink is not a magic answer. It is a small signal in a larger experience strategy. The real work is deciding how your product should behave when the network is imperfect, because for many users, it often is.
Try It Yourself
Want to see these concepts in action? I’ve created an interactive demo where you can experiment with the code and see real-time results.
Explore more demos from my previous articles in the Demo Gallery.
Happy coding!